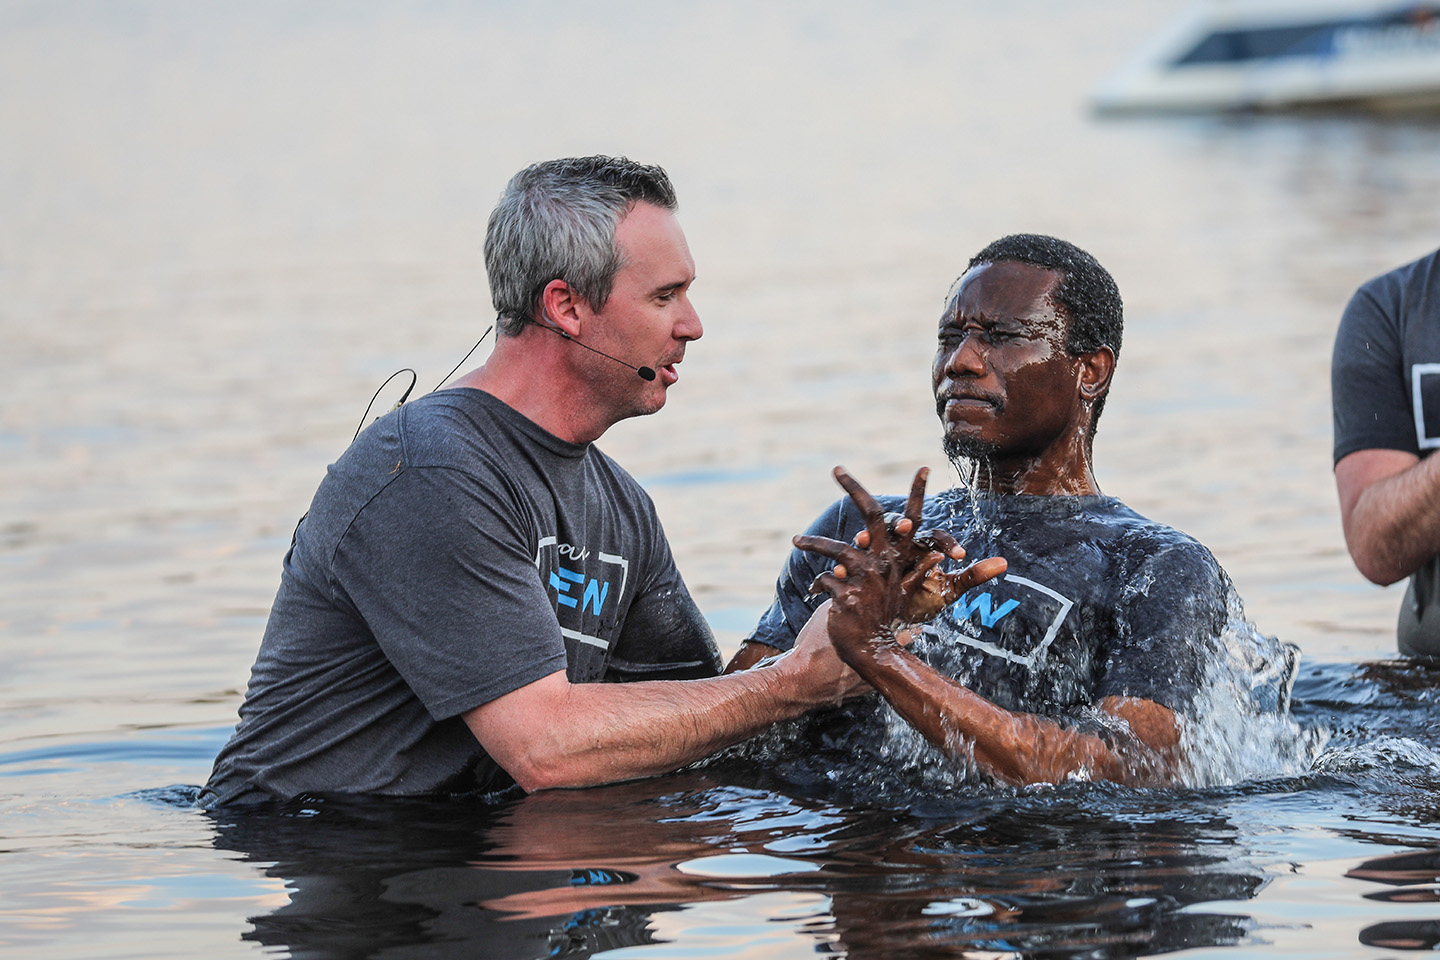
With far fewer churches gathering in person, Southern Baptist congregations didn’t do much baptizing during the pandemic. Those numbers have increased in recent years, but the overall decline within the Convention continues.
In 2022, Southern Baptist congregations that reported figures for the Annual Church Profile (ACP) recorded 180,177 baptisms, a 16% increase over 2021. Combined with the 26% increase in 2021, Southern Baptists have seen a 46% increase over the past two years emerging from the COVID-19 pandemic. Despite those recent jumps, the numbers are still part of a negative trend since the early 2000s.
Southern Baptist congregations reported 414,657 baptisms in 2000, the last year totals climbed above 400,000. The past two years marked the only time this century when baptisms increased two years in a row. In 2017, the average church had 7.9 baptisms. In 2022, the most recent ACP data available, churches averaged 5.4 baptisms.
“To Baptists, baptism is more than a religious ritual. It marks an outward, obedient, public profession of faith,” said Scott McConnell, executive director of Lifeway Research. “The mission of New Testament churches is to make disciples, and those who are baptized represent much celebrated converts to following Jesus Christ.”
More than 2 in 5 (43%) Southern Baptist churches reporting in the ACP had no baptisms in 2022. Close to a third (34%) baptized one to five people, while 9% saw six to nine baptisms. Around 1 in 8 (13%) reported at least 10 baptisms, including 5% who saw 20 or more baptized at their church.
Demographic differences
Churches in the South, those in urban areas and congregations established most recently had higher raw numbers of baptisms in 2022. Southern Baptist churches in the South averaged 5.8 baptisms while those in the Northeast (4.2), Midwest (4.2) and West (3.9) averaged lower.
Churches in more highly concentrated areas of people were more likely to have a higher number of baptisms. Those in urban areas averaged 8.6 baptisms, more than those in the suburbs (5.5) or rural areas (3.1).
In general, the newer the church the more baptisms they saw. Churches founded since 2000 averaged 6.1 baptisms, while those that began between 1950–1999 averaged 5.8, those founded between 1900–1949 averaged 5.2, and congregations that date prior to 1900 averaged 4.9 baptisms.
The relationship between small group or Sunday School participation and total baptisms is not as straightforward as other factors. But congregations with less than 25% of their worship attendees participating in groups ministry are the most likely to have zero baptisms (49%) and the least likely to have 10 or more baptisms (11%).
Overall, those with the least group participation averaged the fewest number of baptisms among congregations that reported their worship service and small group attendance (5.5). Churches with 25% to less than 50% of their worship attendees participating in small groups averaged 6.4 baptisms. Those with 50% to less than 75% participation averaged 6.1. And those with 75% to less than 100% saw an average of 7.2 baptisms. Churches with as many involved in groups as attend their worship services averaged 5.9.
Almost every demographic group saw a significant decline in the number of baptisms per year when compared to 2017 averages. The totals for the Northeast region, churches with 100–249 in worship, churches with 250–499 in worship and those with 100% of their worship attendance or more involved in groups saw no numerical significant change. Churches with 500 or more in worship attendance were the only group with a significant increase in the number of baptisms in 2022 compared to 2017, growing from 5.2 to 5.6.
Baptisms adjusted for attendance
Another way to examine baptisms and rates for churches is by considering the number per worship attendees. Unfortunately for Southern Baptists, that number is also in decline. With worship attendance also falling, that means baptisms are falling at a faster rate than attendance.
“Larger churches have a bigger group of people to be sharing the gospel, so we would expect them on average to see more baptisms,” said McConnell. “By making this adjustment for size we can describe the churches that are more and less effective with the missions force they have in their church. The group of churches that sees the most baptisms per 100 in attendance are newer churches.”
Among Southern Baptist churches that reported attendance in 2022, for every 100 people attending a worship service in a Southern Baptist church, five people were baptized on average. In other words, it took 20 Southern Baptists to reach one person. While that is the best number in the past four years, it’s still a decline from 2017 (5.9 per 100) and part of an overall negative trend.
In 2022, 34% had zero baptisms per 100 attendees. Around 1 in 3 (32%) averaged more than zero to five baptisms per 100 worship service attendees. More than 1 in 5 (20%) averaged more than five to 10 and 13% averaged more than 10 baptisms per 100 attendees.
While the South had more total baptisms per church, the picture is different when adjusting for attendance. The South (5.0 baptisms per 100 in worship attendance) is similar to the Midwest (4.9) and the Northeast (5.1), while the West (6.2) has the highest rate. Much like they were in total baptisms, urban congregations (6.2) had higher rates than suburban (4.8) or rural churches (4.7).
Again, newer churches fared better than older ones when evaluating baptisms per 100 worship attendees. Those organized since 2000 baptized 7.8 per 100, more than those started between 1950–1999 (4.9), those beginning from 1900-1949 (4.7) and those that began before 1900 (4.1).
More group participation didn’t directly predict more baptisms, but those with the fewest participating were the most likely to have zero baptisms per 100 in attendance (49%) and those with 100% or more in groups averaged the most baptisms per 100 (6.5).
EDITOR’S NOTE — This story was written by Aaron Earls and originally published by Lifeway Research.

